News:

SMF - Just Installed!

Main Menu
Menu

Show posts

This section allows you to view all posts made by this member. Note that you can only see posts made in areas you currently have access to.

Show posts Menu

Messages - Tranquility Bass

#271
Minimal overshoot and ringing with a well defined transition period !

CLK-CPLD.bmp

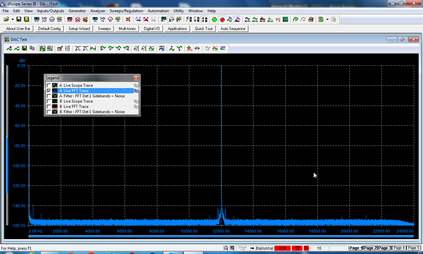
Expanded scale with equivalent time sampling rate of 100 Gs/s !

CLK-CPLD(expanded).bmp
#272
Minimal overshoot and ringing with a well defined transition period !

CLK-ADC.bmp
#274
Very well defined with no overshoot and smooth crossover transition !

CLK-OSC.bmp
#275
Performance and Measurements / Frequency Measurement
November 19, 2020, 08:19:11 PM
Frequency is pretty much spot on !!

P1050102.JPG

#276
Performance and Measurements / Clock Fidelity Test
November 19, 2020, 07:02:18 PM
Test Methodology:

In these tests we are using a wide bandwidth digital scope to view the 49.152MHz master clock waveform at various points in the clock network. It is impossible to make proper measurements of a clock source unless you use a scope with a suitable bandwidth that can at least capture the 21st harmonic of the fundamental frequency of the clock frequency which means a scope with at least a 1GHz bandwidth. Not only that you need to use a probe with an equivalent or greater bandwidth to the scope and preferably an active probe to minimize loading.

To avoid loading down the device under test we use an active probe (Tek P6204) with at least 1GHz bandwidth along with the shortest ground connection to minimize loop inductance in the probe which would manifest itself as ringing in the waveform. We used a Tektronix TDS784A DSO scope with a 1GHz bandwidth and real time sampling rate of 4Gs/s as well as a 10Gs/s equivalent time sampling rate for our measurements. For the expanded scale measurement the scope was set to an equivalent sampling rate of 100 Gs/s. What we are looking for is minimum ringing and overshoot without any kinks in the clock transition interval.

Test Results:


Conclusion:

As one can see from the scope shots below that in all cases the clock wave-forms are clean and stable and show minimum overshoot which means that the clock outputs are properly matched to the board traces in order to minimize transmission line effects and reflections.

P1050107.JPG

Tektronix P6204 Low Capacitance Active Probe with 1GHz bandwidth

P1050109.JPG

Active Probe applied to clock circuit using the shortest possible ground connection for minimum induced ringing and overshoot ;)

P1050106.JPG


#277
News Updates / Visiting Purifi Audio
November 01, 2020, 03:34:11 PM
Since we have an interest in using some of the products from Purifi Audio in a new project this article makes for interesting reading ;)

https://www.hifishark.com/article/visiting-purifi-audio

#278
The Latest test results and measurements from our Lab show the Ultimate-Preamplifer 2/+ meets or exceeds its design objectives by a huge margin ! Click here to view more.

#279
Some mains induced noise caused by leakage flux from the transformer coupling into the unbalanced connections between the DSP board and the unbalanced output boards in the same way earth loops are setup in unbalanced connections between equipment !. The balanced outputs do not exhibit this since the balanced connections between the boards cancels out the mains induced noise ! However the mains induced noise components on the unbalanced outputs is still 120dB below the reference level so we don't have to lose any sleep over this ;)

Noise Only (Unbal@0-20kHz A-weighted).png
#283
Applies to: EUTs with analogue or digital inputs and analogue or digital outputs.

Aim: To measure the THD+N of the EUT against frequency.

Method
A -1dBFS sinusoidal stimulus is applied to the EUT, successively at each octave frequency between
20Hz and half the upper band-edge frequency. The output of the EUT is passed through a standard
notch filter at the frequency of the stimulus, and also through a low-pass filter at the upper band-edge
frequency (or at 20kHz, whichever is the lower). The RMS amplitude of the residual is measured for
each stimulus frequency.

The results are presented graphically, with THD+N (in % relative to the amplitude of the stimulus)
being plotted for each channel against stimulus frequency.

The test is then repeated with a stimulus amplitude of â€"20dBFS, the results being overlaid on the
original graph.
#285
Applies to: EUTs with analogue outputs.

Aim: To measure the total of HF imaging components beyond the audio band which are output from
the EUT's D/A converter, as a result of applied audio-band signals.

Method
The analogue output of the EUT is measured with a â€"20dBFS sinusoidal stimulus applied, swept from 10Hz to the upper band-edge frequency or 10kHz (whichever is the lower). Components within the audio band are excluded by using the standard high-pass filter. The total RMS amplitude of all the components above the upper band-edge frequency of the EUT is measured for both channels at each frequency, and plotted graphically. The greatest result for each channel,expressed in dBFS, is also presented at the end of the test.

References
http://resources.prismsound.com/tm/dS3_Applications_Manual_A4nc.pdf